Maximizing Julia Development with VSCode Extension
Optimize your development workflow and comfort with Julia.

In this article, we will review some of the features that the Julia extension offers! If you don't have Julia, VS Code, or the Julia extension already installed, look at this article to help you get set up!
Running a Julia File
Now that we have the extension installed and configured, we can start using the extension. One of the first things we will examine is the most basic feature - running code! To run code, we do the following:
- Click the drop down in the top right of the code window
- Click "Julia: Execute Code in REPL"
- Enjoy the results!
When you hit Ctrl+Enter, the line your cursor is currently on will run, and the cursor will advance to the next line.
This is one way to step through the code line by line.
You are also able to use Ctrl+F5 (Option+F5 for Macs) to run the entire file. You can learn more about running Julia code from the official documentation.
Code Navigation
The information in this section applies to any language and is not exclusive to the Julia extension. The features below are helpful to know and can increase your productivity as you code.
Within VS Code, if you use Ctrl+P, a prompt will open at the top of your editor. In that prompt, you can start typing the name of a file you want to jump to in your project. Once you click the option (or press enter), VS Code will jump directly to that file. You can also use Ctrl+G to jump to a specific line number in the file if you know which line you are looking for. Being able to jump back and forth between files without having to search the file tree will greatly enhance your workflow. Imagine all the time you will save by not searching through file trees!
Using Ctrl+Shift+O (be sure to use the letter O, not the number 0) will allow you to navigate through individual symbols within your program. After using the shortcut above, type : and all your symbols will be grouped by type. You are then able to navigate between them all.
Editing Code
Code navigation is a great skill to develop, especially when given some wonderful legacy code to unravel...we've all been there. Being proficient in navigating your code does you no good unless you are also proficient at editing the code.
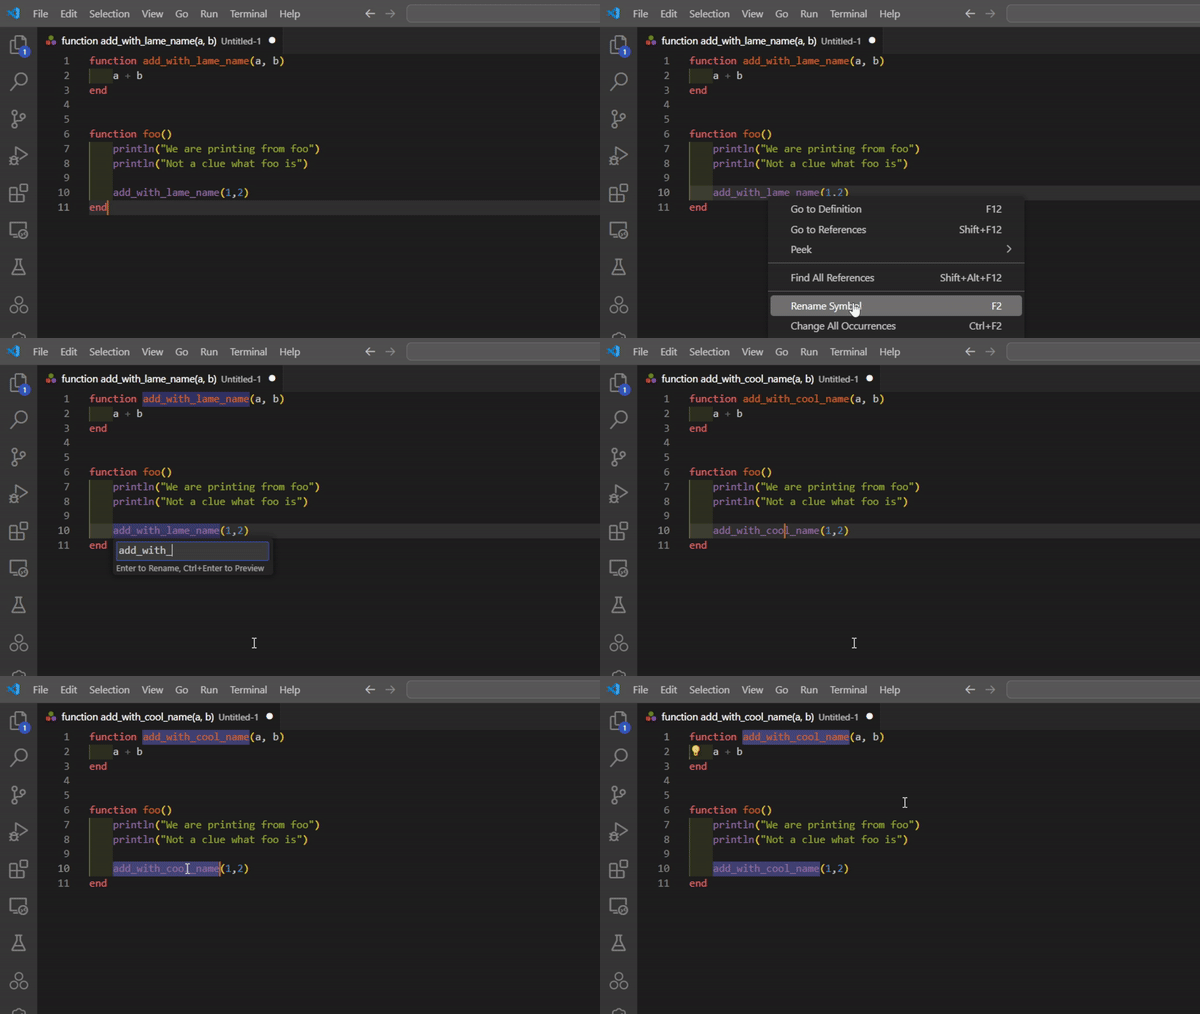
One way to get going quickly is to use the "rename symbol" shortcut. You can either right click on a symbol and press "rename" or hit F2. When you rename the symbol, it will be renamed everywhere else in the file that it exists. Pretty neat, huh?
The Plot Viewer
Up until this point in the article we have laid the ground work for working with your code in VS Code. Next, we will look into some of the Julia specific features that the Julia extension offers, starting with the plot viewer.
The plot viewer is a really handy tool that lets you...well...view plots. We can look at an example to see how it works.
First, we will install the plots package if it hasn't been installed already.
julia> using Pkg
julia> Pkg.add("Plots")
# OR
# We can type the "]" key and use the package interface
(@v1.10) pkg>
(@v1.10) pkg> add Plots
After we do that, we can create a plot to visualize.
using Plots

function make_plot()
    # Create a plot
    p = plot()

    θ = range(0, 2π, length=100)
    x = cos.(θ) * 5
    y = sin.(θ) * 5
    plot!(p, x, y, linecolor=:black, linewidth=2, legend=:topright)

    x_left = 1 .+ 0.5 * cos.(θ)
    y_left = 2 .+ 0.5 * sin.(θ)
    plot!(p, x_left, y_left, linecolor=:black, linewidth=2, fillalpha=0.2)

    x_right = 3 .+ 0.5 * cos.(θ)
    y_right = 2 .+ 0.5 * sin.(θ)
    plot!(p, x_right, y_right, linecolor=:black, linewidth=2, fillalpha=0.2)

    θ_arc = range(0, π, length=10)
    x_arc = 2 .+ cos.(θ_arc) * 2
    y_arc = -1 .+ sin.(θ_arc) * 1
    plot!(p, x_arc, y_arc, linecolor=:black, linewidth=2)

    # Adjust plot limits and display the final plot
    xlims!(-6, 6)
    ylims!(-6, 6)
    display(p)
end

# Execute the function to plot
make_plot()
Next we run this by using the keyboard shortcut we learned earlier (Ctrl+Enter), and we can see the result below!
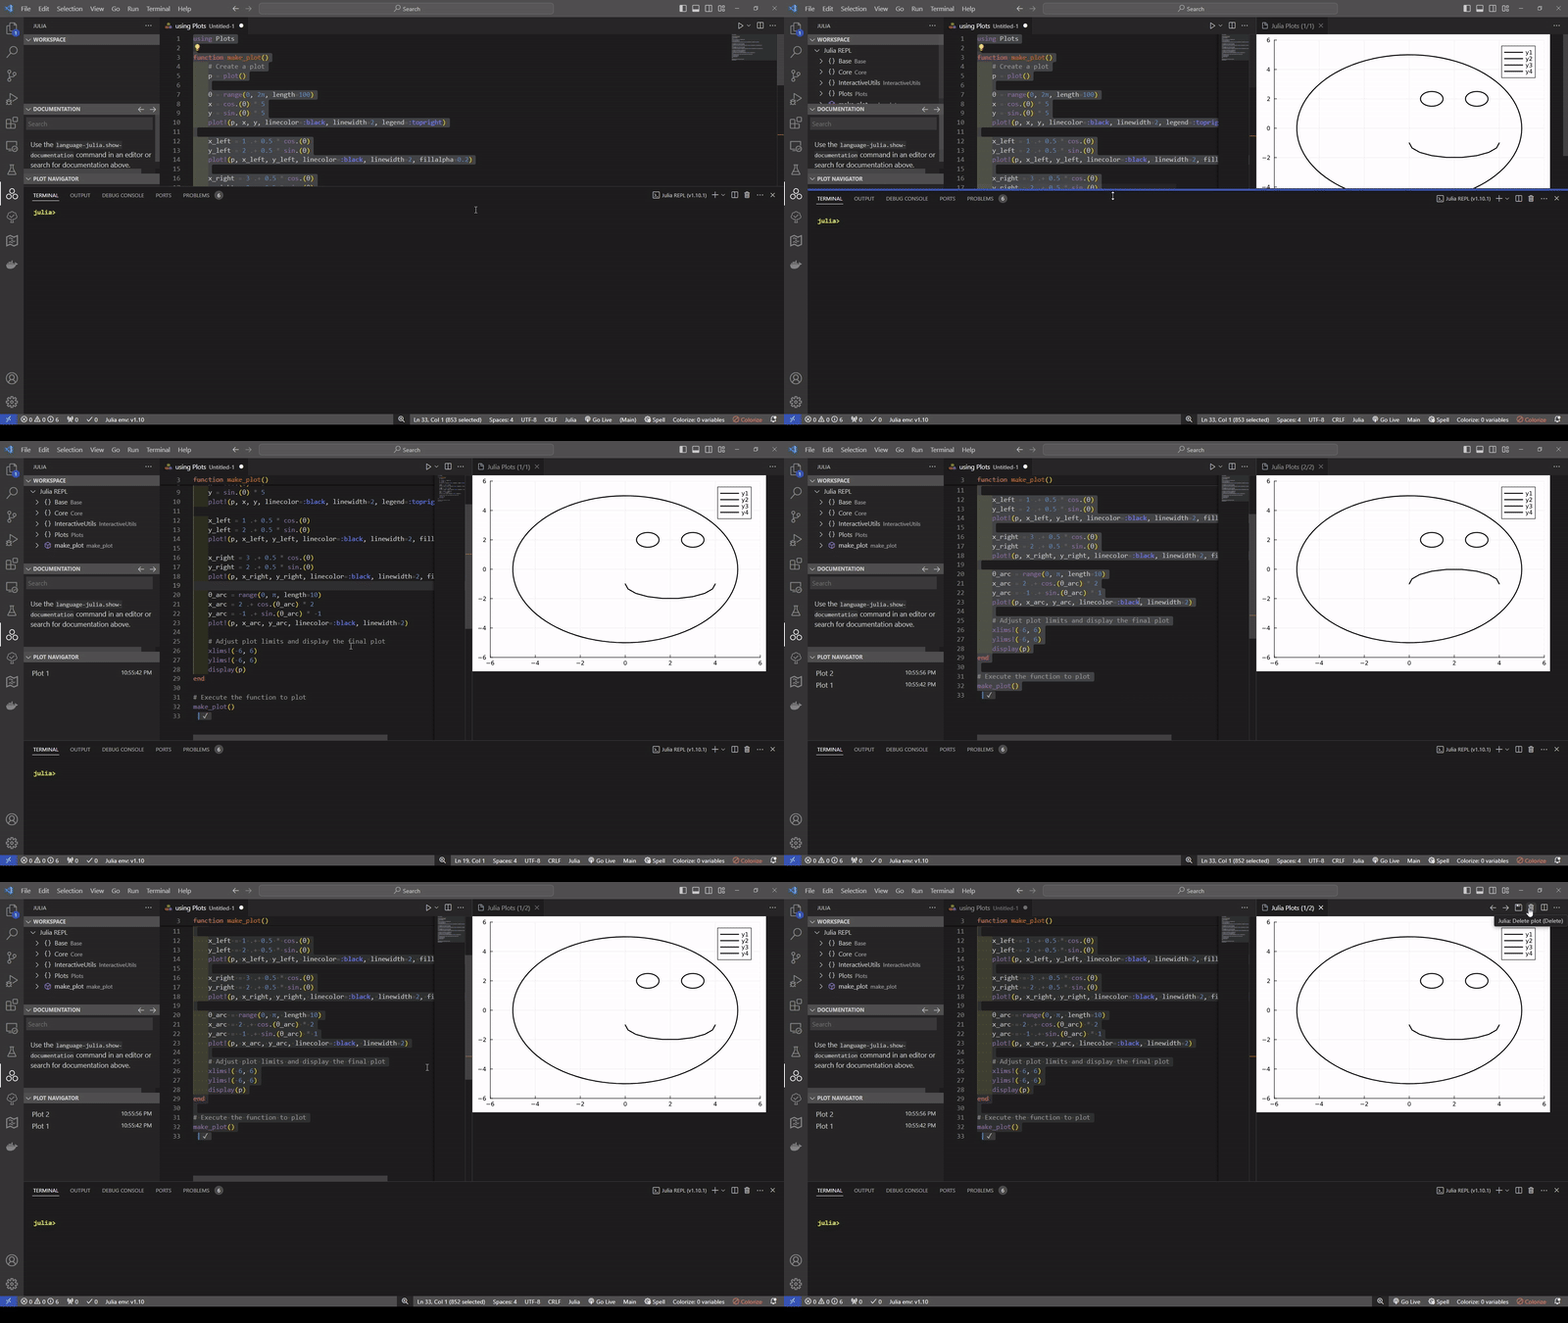
Pretty cool! Now we can see our charts generated in real time right inside our editor!
The Table Viewer
I don't know about you, but I never liked having to try and dump the contents of an array, matrix,
or other data structures to the console and try and parse through the data. Lucky for us we don't have to do that.
The Julia extension allows us to view any Tables.jl compatible table in the special table viewer.
There are two ways to do this.
The first way is by clicking the "View in VS Code" button next to your table in the "Workspace" section.
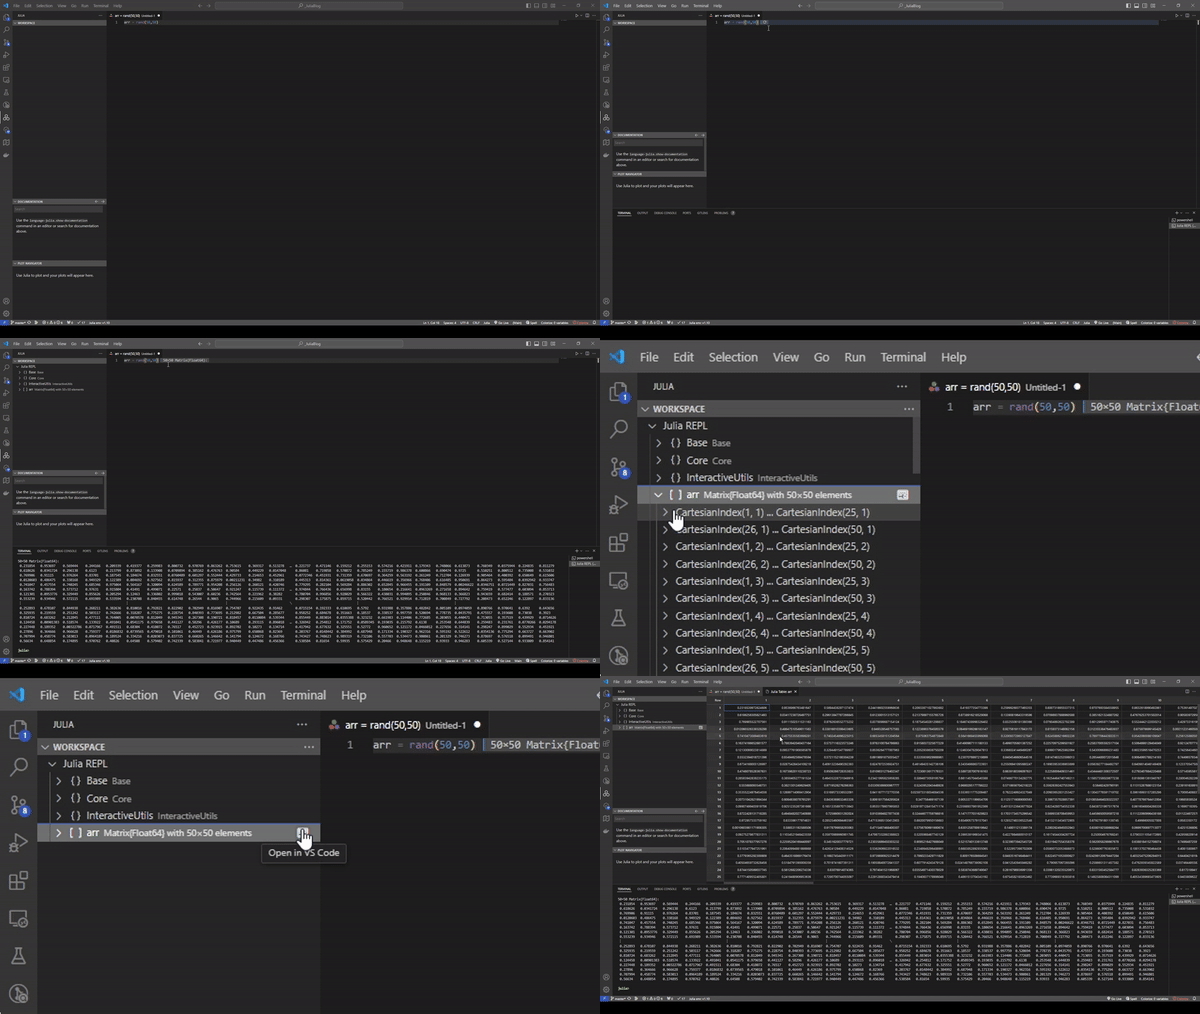
The second way to do this is by running the vscodedisplay(name_of_table) directly in the REPL.
It's pretty cool if you ask me.
Having the ability to view the data is a nice feature, but to make it even better, you can sort the data in the UI by clicking the column headers. You can also copy data by using Ctrl + C just like you would in Excel!
A word of caution: All the table data you see is cached so any changes you make will not be reflected in the table viewer. To fix that just re-display the table in the editor and you will see your changes.
Debugging
The last topic we will cover is the debugging tools.
There are many things you can do in the VS Code debugger that are not language-specific. We aren't going to cover all of those features here, so if you want a more in-depth look, check out the official documentation.
Since the only truly bug free code is no code, we will start by writing some code that we can test and try to catch bugs in.
function do_math(a, b)
    c = a + b
    d = a * b
    c + d
end

function print_things()
    println("First print")
    println("Second print")

    var = do_math(5,8)

    println("Third print and math: ", var)

    var2 = do_math("Bug",3)

    println("Fourth print and bug: ", var2)
end

print_things()
We have code to run, so we can run the debugger and see what we get. First, we must switch to the "Run and Debug" tab. We do this by either clicking on the tab (the one with the bug and play button) or by hitting Ctrl+Shift+D.
Once we are there, we will be greeted with a screen like this:
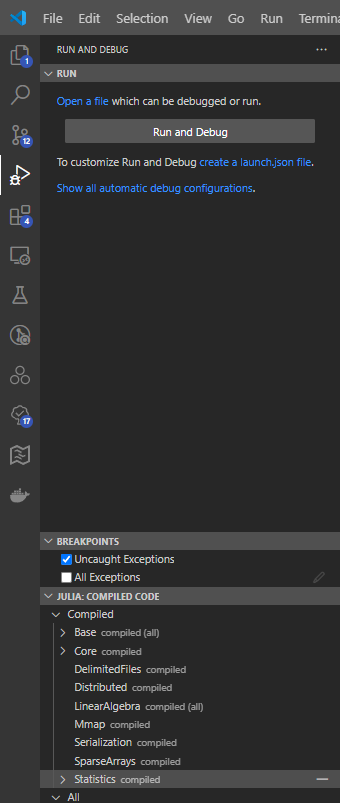
From here we can observe the compiled Julia code, our breakpoints, and several other things as the program runs. We will want to run our code through the debugger, and to do that, we can either click the big "Run and Debug" button or hit F5.
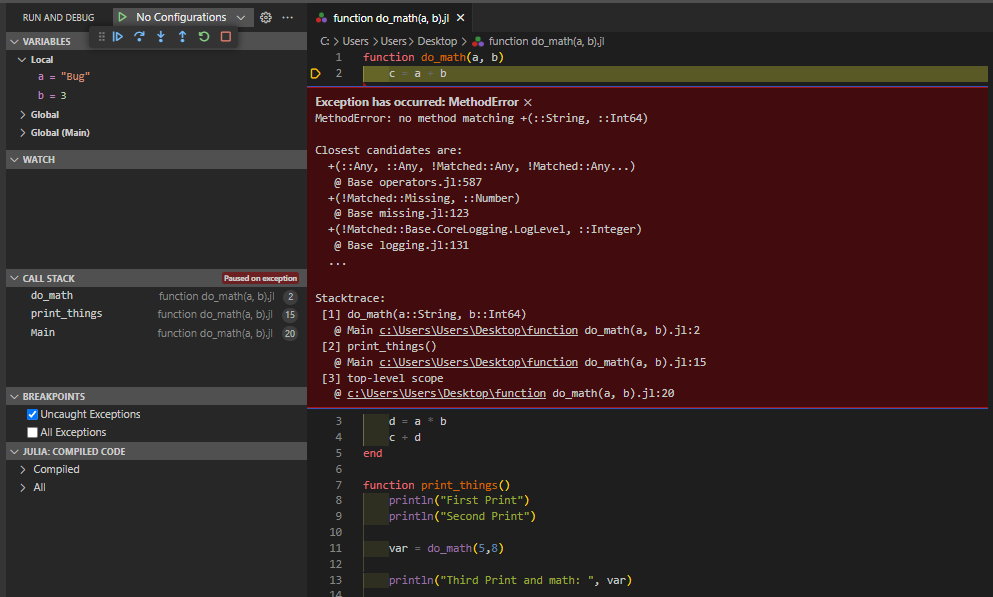
We step through the code a bit, and see some of what the debugger will show us.
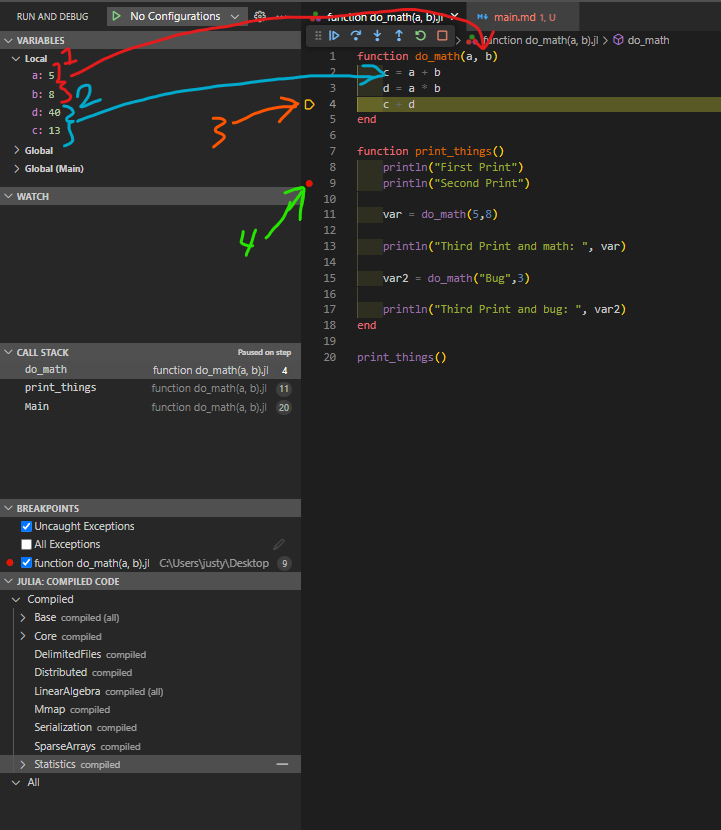
1: The variables passed into the function
2: The variables local to the function
3: The indicator of which line we are currently on
4: A breakpoint indicator
We can set our breakpoints by double clicking next to the line numbers. After setting our breakpoints, we will be able to step through the code. As we step through the code line by line, the variables that get created are populated in the top section and their values are shown. Another neat feature the debugger gives that is not highlighted above but should be noted is the "CALL STACK" section. As the name suggests, this will show us the entire call stack as you step through the code. All of these are most likely things we have seen before in other debuggers, but they are useful nonetheless.
Keyboard Shortcuts
To wrap up, let's look at a list of keyboard shortcuts for effective Julia extension usage.
Note that a command like Alt+J Alt+C means press Alt+J followed by Alt+C.
| Command | Shortcut |
Execute Code in REPL and Move | Shift+Enter |
Execute Code in REPL | Ctrl+Enter |
Execute Code Cell in REPL | Alt+Enter |
Execute Code Cell in REPL and Move | Alt+Shift+Enter |
Interrupt Execution | Ctrl+C |
Clear Current Inline Result | Escape |
Clear Inline Results In Editor | Alt+J Alt+C |
Select Current Module | Alt+J Alt+M |
New Julia File | Alt+J Alt+N |
Start REPL | Alt+J Alt+O |
Stop REPL | Alt+J Alt+K |
Restart REPL | Alt+J Alt+R |
Change Current Environment | Alt+J Alt+E |
Show Documentation | Alt+J Alt+D |
Show Plot | Alt+J Alt+P |
REPLVariables.focus | Alt+J Alt+W |
Interrupt Execution | Ctrl+Shift+C |
Browse Back Documentation | Left |
Browse Forward Documentation | Right |
Show Previous Plot | Left |
Show Next Plot | Right |
Show First Plot | Home |
Show Last Plot | End |
Delete plot | Delete |
Delete All Plots | Shift+Delete |
Summary
We reviewed some of the basics of the Julia VS Code extension. We looked at running a Julia file, the basics of code navigation and editing, the usefulness of the plot and table viewers, and some basic debugging features. This was only an overview, and there is much more that the extension has to offer! If you would like to do a deeper dive into the Julia VS Code extension, visit the official documentation or their GitHub.
If you would like to learn more about Julia so you can fully take advantage of the extension's features, check out our Julia Basics series!


